2008年10月27日

Make a contour by ArcGIS

Before using ArcGIS, please make sure the tool”Spatial Analyst” has chosen.
(if not, go to check “tool”-->”customize”-->”toolbars”-->”spatial analyst”

1.the same as ArcView, Be sure your data is numeral.
2.Open ArcMap,
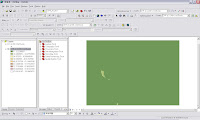
“tools”-->”add XY data”, then the interface will look like this


3.Definition the range of analysis
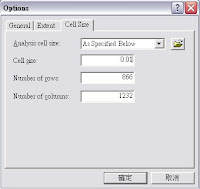
Spatial Analyst-->Options-->Cell size-->AS specified below(you can choose any size you want , for this example, it’s “0.01”


4.Point-->contour
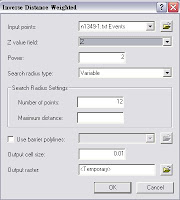
Spatial Analyst-->Interpolate to RasteràInverse Distance Weighted.
In Z value field, choose the data you want to draw, then clip OK


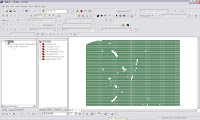
5.Final, the appearance will like that.


2008年10月20日

How to make points to a contour

1. Be sure ur data is “double”,if in your text file has any word, ArcVeiw (or ArcGIS)can’t read it.


2.Open ArcVview 3.x(Before open it ,make sure ur computer instanll”3D analyst &spatial analyst”
2.1 point “table”-->”add”
2.2 view-->"add event theme"
2.3 surface-->interplate Grid, choose “output Grid Cell Size=0.01(as well as you want)
2.4 click OK

2008年9月20日

如何截取你想要的圖。

在研究上,碰到一個案例,就是有一張圖外面是台北縣,裏面是台北市。但是我只想要台北市的圖就好。那該怎麼做呢?
在arccatalog中,創造一個shp檔。記得在創造的時候,要選擇"面"(有點、線、面可以選).之後在叫出gismap,開啟剛建立的shp檔跟台北縣市的圖層。然後按編輯,選擇編輯剛建立的shp檔,繪製一個跟台北市大小差不多的長方形。之後儲存編輯,並關掉編輯。在toolbox,選擇intersect,把剛編輯的shp檔與台北縣市圖層作intersect,intersect之後的圖,就是你想要的單純的台北市的圖層了!!!!!

關於坐標轉換與從gis匯入坐標點的方法。

第一個:坐標的轉換。從經緯度轉換到TM2。先把分跟秒轉換成度的單位。例如:分要乘於1/60, 秒要乘於1/3600。加上度。完全變度後,利用transform的軟體轉換成TM2。值的一提的是,東經是x軸,北緯是y軸喔。不要搞混喔。我記得有一次就搞混,填了相反的值,轉換出來,我當場傻眼,以為這轉換的軟体,是不是程式寫錯了。要切記!要切記!
第二個:匯入坐標點的方法。先在excel中,第一列先打X,Y。之後打上你要的坐標點。儲存成其它格式,儲成CSV檔。之後就可以在GIS中,讀的到了。另外也有一個方法,就是在記事本中,第一列打X,Y,接下來,在下面打你要輸入的座標。記得要座標與座標之間要用逗號(,)喔。打好之後,在GIS就會讀的到了。也許你會問,那空白隔的開,GIS會讀的到嗎?答案是:讀不到的。

2008年9月3日

ArcGIS 9.2 Installation

台大校園版ArcGIS 9.2安裝步驟 (參考台大地理系提供之安裝步驟)

學校版的ArcGIS 9.2,可至ftp://140.112.64.249,用帳號esri,密碼esri123登入下載。
下載後,用內附的Alcohol 120%來燒成DVD光碟片。

ArcGIS是ESRI公司GIS系列產品的統稱,一般最常用的產品是 ArcMap和ArcCatalog。
安裝之大致步驟
  1. 置入光碟片
  2. 選ArcGIS Desktop
  3. 選Install ArcGIS Desktop
  4. 遇到問License Manager時,輸入140.112.64.90
  5. 建議選擇?完整安裝?(complete installation)

若有一些錯誤,不要管它,直到安裝完,即可使用了。

詳細的安裝步驟可以參考
http://www.bp.ntu.edu.tw/WebUsers/ftlin/course/gis/台大校園ArcGIS 詳細安裝程序.doc
實際的步驟可能隨著版本而略有不同,但基本上,程序是一樣的

啟動ArcMap
  1. 於 開始/所有程式/ArcGIS下,點選ArcMap
  2. 可以先選a new empty map,按 OK
  3. Tools/ Extensions/
  4. 選擇 3D Analyst, Geostatistical Analyst, network analyst, spatial analyst,…等常用的空間分析功能

2008年8月29日

AGGREGATE IN ARCGIS

以下要介紹有關於(1.)將excel檔存成dbf檔的小技巧

(2.)用ARCGIS作aggregation


  1. excel檔存成dbf檔的小技巧

據說以前的excel可以直接存成dbf檔,可是現在excel不支援了!

所以運用microsoft office access資料庫來轉換檔案格式

Step. 用access來開啟excel檔案→檔案按右鍵匯出→選取dbase檔案→完成


  1. 用ARCGIS作aggregation

    前言:因為我手邊登革熱資料的鄉鎮行政去劃分跟台灣鄉鎮地圖不一樣,一

    個將中區跟西區分開,另一個則是合稱中西區,要將中區、西區併在

    一起,需要運用aggregate作結合。


    Step1.將這兩區的編碼改成相同的


Step2.儲存,並將excel檔轉成dbf檔

Step3.開啟ARCGIS→運用help的功能在索引上打aggregate→選擇coverage

data →dissolve(coverage)


Step4.按下related topics→在點選dissolve的選項


Step5.按open tool按鍵,會出現dissolve視窗→input data→勾選需要aggregate的項目,其餘項目再做運算


Step6.在data table上按options→add field→輸入名稱


Step7.在標題上按右鍵→calculate geometry→yes→完成所有資料整合與內容恢復


2008年8月11日

Stemlab FTP

ftp://140.112.190.162

2008年8月6日

Hua-Tung Bike trip

誌鑫和化龍腳踏車遊花東 (2008/08/02-2008/08/04)

2008年7月29日

Typhoons Bury Tons Of Carbon In The Oceans

http://www.sciencedaily.com/releases/2008/07/080724084745.htm#

ScienceDaily (2008-07-28) -- A single typhoon in Taiwan buries as much carbon in the ocean -- in the form of sediment -- as all the other rains in that country all year long combined.

Presentation

Here is the video provided by Jerry and originally from a researcher in Carnegie Mellon University. It can be a possible presentation setting for our group meeting.
Its software can be downloaded from http://www.cs.cmu.edu/~johnny/

2008年7月26日

Freeware website

這是教育部推廣自由軟體的網站
裡頭有各式各樣 辦公研究可能會用上的軟體

2008年7月19日

A potential research topic

Let me know if you are interested in this topic

預報失靈暴雨淹台奪13命 半個台灣灌爆 中市雨量破表

更新日期:2008/07/19 04:34 李宗祐、陳可文綜合報導

卡玫基颱風外圍環流昨日引進強烈西南氣流「灌爆」近半個台灣!連離島澎湖也出現史上最強的暴雨,昨天單日降雨超過四二九毫米,刷新當地最高日雨量紀錄;台中市也打破當地歷年七月最高單日降雨紀錄,台中氣象站雨量觀測儀更被暴雨「灌」到秀逗,接連鬧罷工。

中央氣象局預報中心主任吳德榮指出,昨日的衛星雲圖顯示,有個範圍涵蓋近百公里的中尺度「超大對流胞」籠罩在整個台灣,再從氣象雷達看到無數個小對流胞在此「超大對流胞」裡面到處流竄,因此,台灣西半部同時在苗栗以南出現大豪雨或超大豪雨。

中市觀測儀被「灌」到秀逗

澎湖昨日到晚間八時四十分的累積雨量達四二九毫米,雖然不是全台之冠,卻提前打破當地在一九七四年七月六日出現三五二.九毫米的單日最高降雨紀錄。昨日中午十二時到下午一時出現七十一毫米的時雨量,打平當地歷年七月第二大時雨量紀錄。

台中氣象站雨量觀測儀經不起豪雨猛灌,從早上七點就開始鬧罷工。氣象局預報員陳維良表示,台中氣象站的自動雨量觀測儀,因雨勢過大,導致水分滲透進入電源器,發生短路而故障。值班人員雖緊急以人工雨量觀測儀取代,撐了一個小時,又被「灌爆」。

到底下了多少雨 無法確認

值 班人員馬上改用「最古典」的虹吸式雨量計,卻又接連故障,早上八點以後就無法再觀測,也因此台中市昨日到底下了多少雨,連氣象局都無法確認。但根據台中氣 象站在雨量觀測儀接連掛點前,傳回的觀測資料,光是昨日零時到上午八時累積雨量就高達三九三毫米,打破二○○四年七月三日敏督利侵台時,創下的當地七月最 高降雨紀錄(三○八.八毫米)。

台中市從昨日清晨四時開始到上午八時,連續四個小時出現雨量超過五十毫米的時雨暴,尤其是上午七時到八時時雨量高達一○○毫米,也難怪台中氣象站自動雨量觀測儀會被「灌到」秀逗。

若以鄰近台中氣象站、位於北屯區大坑自動雨量觀測儀,在昨晚八時四十分觀測到五八九毫米累積雨量,台中市昨日單日降雨很可能有機會超越一九五九年八月八日出現的六六○.二毫米最高日雨量紀錄。

2008年6月10日

Building GSL 1.8 under Windows Step By Step

This article is from the discussion thread at this page


Assuming you use Visual C++ 2005 - Studio Vers. 8.

// 1) Get the sourcecode
- Download the sources:
http://gnuwin32.sourceforge.net/downlinks/gsl-src-zip.php
- decompress

// 2) Configure
- Open the config.h.msvc in the VC8 directory
- change "#define HAVE_DECL_LOG1P 1" entry to "#define HAVE_DECL_LOG1P 0"
(just to be on the safe side: change all #define HAVE_... 1 to 0)

// 3) Make
- open the visual studio solution libgsl.sln in the VC8 directory.
- Build->Batch Build
- Check the configurations you need (DLL/Static/Debug/Release) and build them
(if you don't know what you need, check everything EXCEPT the 4 install_libgsl
entries)

// 4) Install
- Open the Property Page of the install_libgsl project (SolutionExplorer->right
click->Properties)
- Select "All Configurations"
- Go to Configuration Properties -> Build Events -> Pre-Build Event
- Edit the command line (click [...])
- Change the install location in the second line (to your GnuWin32 directory)
(If you installed the gsl win32 binaries with standard paramteres that's
C:\GnuWin32)
- Build the "install_libgsl" project (SolutionExplorer -> right click -> build)

// 4.1) Fix the directory error
If there are no .lib or .dll files in the /lib and /bin directory the copy
source directories are wrong:
- Go to the Pre-Buil Event command line again (see Step 4)
In my version there where whitespaces in all Debug-StaticLib,
Release-StaticLib,
Debug-DLL, Release-DLL entries
If you are finished with step 3) those should be the same as your build output
directories
- Just change everything that looks like this: ../Debug - Static Lib/..
to ../Debug-StaticLib/..
( The same with: Release - Static Lib, Debug - DLL, Release DLL)
- Build the "install_libgsl" project

How do I use GSL on Visual C++ 2005 ?

This article is originally from the site. Here is its copy.

DOWNLOAD AND INSTALL GSL SOFTWARE

1.Download gsl-1.8.exe from http://sourceforge.net/project/showfiles.php?group_id=23617&package_id=19804
(contains binaries and .lib files)
2.Execute and finish the installation.

3.Download gsl-1.8-src.exe from http://sourceforge.net/project/showfiles.php?group_id=23617&package_id=19804
4.Execute and finish the installation.

BUILD GSL LIBRARIES FOR Visual studio
1. Launch Visual C++ Studio
2. Open project C:\Program Files\GnuWin32\src\gsl\1.8\gsl-1.8\VC8\libgsl.sln (assuming default path - replace if it is a different location)
3. Do a build all
4.Verify that after build is complete, new files are generated in subfolders in C:\Program Files\GnuWin32\src\gsl\1.8\gsl-1.8\VC8\libgsl

CONFIGURE PATH SETTINGS IN VISUAL C++ STUDIO
1.Launch Visual C++ studio
2.Select Tools->Options Menu
3.On the tree display in the Options dialog box, select branch for Projects and solutions->VC++ directories
4.On the right side of the dialog, select Executable files in the "show directories for" combo box and add the following paths:
C:\Program Files\GnuWin32\src\gsl\1.8\gsl-1.8\VC8\libgslcblas\Debug-DLL
C:\Program Files\GnuWin32\src\gsl\1.8\gsl-1.8\VC8\libgsl\Debug-DLL

5.In the "show directories for" combo box select "Include files" and add the following path:
C:\Program Files\GnuWin32\include

6.In the "show directories for" combo box select "Library files" and add the following paths:
C:\Program Files\GnuWin32\src\gsl\1.8\gsl-1.8\VC8\libgsl\Debug-DLL
C:\Program Files\GnuWin32\src\gsl\1.8\gsl-1.8\VC8\libgslcblas\Debug-DLL

HOW DO I USE GSL LIBRARY IN MY VC++ PROJECT?
1.Launch Visual studio
2.Open your VC++ project.
3.select menu Project -> properties
4.In the property pages dialog, select tree item "configration properties->Linker->Input
5.On the right hand side details, choose the field "Additional Dependencies" and append the following entries by clicking the ... button:
libgsl_dll_d.lib
libgslcblas_dll_d.lib
2008年6月3日

設定台灣地理坐標的方法

我定義系統坐標的方法如下:
First of all →starting arcCatalog→瀏覽這三張圖層 →在圖層上直接點兩下或是按滑鼠右鍵,選擇properties →在選XY coordinate system→如果此圖層沒有座標系統的話,details:是空白的→由於arcgis並沒有內鍵的台灣的TM2度分帶的投影座標系統格式,所以我必須新增→選擇new→projected→name:TM67(or TM97)→projection’s name:Transverse_Mercator→false_Easting:250000,false_Northing:0,Central_Meridian:121,Scale_Factor:0.9999,Latitude_Of_Origin:0→Linear Unit name:Meter→按一下select→Geographic Coordinate System→Asia→Taiwan1967(或taiwan1997, 若想要兩個都建立的話,重複上述的steps)→套用→確定→完成了新增座標系統之後,不要忘了將你的所新增的座標系統,儲存起來→Save as →存在projected coordinate systems裏→以後要用時就方便了。

如何截取一個圖層的中你想要的部份及如何設定你想要的圖層中的坐標單位。

1、這問題非常的簡單,在你要截取的圖層,按右鍵>>open attribute table>>選擇你的要資料後>>再回圖層,也是按右鍵>>data>>export data 。這樣就有截取你想要的圖層了。
2、view→data frame properities→general。就會看到units。有兩個-map跟display都選。

設定gis的地理投影座標系統。

我定義系統坐標的方法如下:
First of all →starting arcCatalog→瀏覽這三張圖層 →在圖層上直接點兩下或是按滑鼠右鍵,選擇properties →在選XY coordinate system→如果此圖層沒有座標系統的話,details:是空白的→由於arcgis並沒有內鍵的台灣的TM2度分帶的投影座標系統格式,所以我必須新增→選擇new→projected→name:TM67(or TM97)→projection’s name:Transverse_Mercator→false_Easting:250000,false_Northing:0,Central_Meridian:121,Scale_Factor:0.9999,Latitude_Of_Origin:0→Linear Unit name:Meter→按一下select→Geographic Coordinate System→Asia→Taiwan1967(或taiwan1997, 若想要兩個都建立的話,重複上述的steps)→套用→確定→完成了新增座標系統之後,不要忘了將你的所新增的座標系統,儲存起來→Save as →存在projected coordinate systems裏→以後要用時就方便了。

c語言-pointer(4)-雙重指標

在c語言中,指標不但可以指向任何一種資料型態的變數,還可以指向指標,這種指標的指標,我們稱為雙重指標。
格式:
型態**指標變數;
舉一個例子:
int **ptri;
int *(*ptri);
char *(*ptrch);
以上皆是合法的宣告。
雙重指標的概念很簡單如下:
宣告一個:
int i=5,*a,**b;

i的值=5,&i=0253FDD4
a的值=0253FDD4,*a=5,&a=0253FDD0
b的值=0253FDD0,*b=0253FDD4,**b=5,&b=0253FDCC

c語言-pointer(3)-指數與陣列(含字串陣列)

陣列可以看成指標的分身。不同的是,陣列的固定長度的記憶体區塊,而指標是一個變數。
舉一個簡單的例子:
int a[3]={5,7,9};
在指標上(要記):
1、值方面:
*a=5
*(a+1)=7
*(a+2)=9
2、位址方面:
a=&a[1]
a+1=&a[2]
a+2=&a[3]
_____________________
字串陣列:(複習一下,文字之後最後一格是存 \0 )
字串陣列多多少少有浪費空間的情形發生,但若是利用指標陣列來解決,嘿嘿~~那就可以達到用就占,不用就不占的完美境界了。
宣告的方式:
一維指標陣列的宣告格式:
型態*陣列名稱[個數];
舉個例子就是:
char *name[3]={"david","jane wang","tom lee"};
舉一個程式:
/*指標陣列*/
#include
int main(void)
{
int i;
char *name[3]={"david","jane wang","tom lee"};

for(i=0;i<3;i++)
printf("name[%d]=%s\n",i,name[i]);
return 0;
}
_________________________________
二維陣列
舉一個例子,宣告一個int num[3][3],二維陣列可以視為多個一維陣列。
int num[3][3]
1 2 3
4 5 6
7 8 9
可以看成:
num[0]→1 2 3
num[1]→4 5 6
num[2]→7 8 9

num={{1,2,3},{4,5,6},{7,8,9}};

就列而言:
num+0代表第一列第一個的位址。
num+1代表第二列第一個的位址。
num+2代表第三列第一個的位址。

就行而言:
無代表

所以要表達第幾列第幾行時的"位址",為以下三種表達:
num+0 *(num)+1 *(num)+2
num+1 *(num+1)+1 *(num+1)+2
num+2 *(num+2)+1 *(num+2)+2
or
num+0 *(num+0)+1 *(num+0)+2
num+1 *(num+1)+1 *(num+1)+2
num+2 *(num+2)+1 *(num+2)+2
or
*(num+0)+0 *(num+0)+1 *(num+0)+2
*(num+1)+0 *(num+1)+1 *(num+1)+2
*(num+2)+0 *(num+2)+1 *(num+2)+2
值得注意的是num+1+1=num+2

若要表達其"值" 的話則為:
*(*(num+0)+0) *(*(num+0)+1) *(*(num+0)+2)
*(*(num+1)+0) *(*(num+1)+1) *(*(num+1)+2)
*(*(num+2)+0) *(*(num+2)+1) *(*(num+2)+2)

c語言-pointer(2)-指標與函數

在函數的return只能回傳一個值。當需要回傳二個值以上的時候,就需要利用到指標了。
(1)宣告一個將指標當成引數傳入函數的函數產原型之宣告。格式如下:
剛開始:fucn(int*,char*);

函數部份(副程式):
int func(int *ptr1,char *ptr2)
舉一個例子:
/*傳回多個數值的函數*/
#include
#include
void rect(int,int,int*,int*);
int main(void)
{
int a=5,b=8;
int area,length;

rect(a,b,&area,&length);
printf("area=%d,total length=%d\n",area,length);
system("pause");
return 0;
}

void rect(int x,int y,int *ptr1,int *ptr2)
{
*ptr1=x*y;
*ptr2=2*(x+y);
return;
}
____________________________________________________
結果:
area=40,total length=26
____________________________________________________
這一個程式可以更改成

/*傳回多個數值的函數*/
#include
#include
void rect(int,int,int*,int*);
int main(void)
{
int a=5,b=8;
int *area,*length;
area=&a;
length=&b;
rect(a,b,area,length);
printf("area=%d,total length=%d\n",*area,*length);
system("pause");
return 0;
}

void rect(int x,int y,int *ptr1,int *ptr2)
{
*ptr1=x*y;
*ptr2=2*(x+y);
return;
}
_____________________________________________________________
結果:
area=40,total length=26
____________________________________________________________
有注意兩者的差別嗎?
指標的秘密在於位址。了解就都懂了。第一個程式是儲在自己的指標的位址。
而第二個程式則是借用a、b的位址,頓時,a,b的值也改變成a=40,b=26。
____________________________________________________________
介紹一下函數的傳回指標型態的變數值,只要在宣告函數原型及定義函數時,在函數名稱前面加上指標符號*,即可傳回指標了。
剛開始
int *maximum(int *);
.
.
.
ptr=maximum(a); /* 不需要有* */


函數部份(副程式)
int *maximun(int *m)
.
.
.
return max;

c語言-pointer(1)-基本介紹

首先,介給一下%u、%p的用法, 兩者適用於&x的輸出。%u是十進位無號整數之格式印出。%p則是十六進位。


前提:指標是call by address. 所以只要改變副程式的值就改變主程式的值。
簡單指標的方法:
(1)int *ptri //宣告一個整數指標ptri。
(2)ptri=&sum //將sum位址設指標ptri存放。
(3)此時*ptri的值=sum的值,ptri的值=sam的位址,&ptri的值=新一個位址。
(4)值得注意的是在宣告int *ptri的時候,其宣告之後還沒有設值,但是可能會有值,原因為可能是記憶体內留有殘值。
(5)值得一提的是宣告一整數變數時,其所指向該變數的指標型態也要是整數。
_____________________________________________________________________
再來介紹的是:位址運算值「&」與依址取值運算值「*」。

位址運算值「&」

&是將變數或陣列元素的位址取出,所以不並不適用在常數或是運算式,如&100、&(i++)等,這都是不合法的使用。

依址取值運算值「*」
沒有什麼好介紹的。

______________________________________________________________________________

(1)特殊用法:
int a,*ptr1,*ptr2;
ptr1=&a;
ptr2=ptr1;
上述的程式,會等於
int a,*ptr1,*ptr2;
ptr1=&a;
ptr2=&a;

________________________________________________________________________________
(2)注意事項:
使用指標時要特別小心,最好在程式中一經過宣告後,立刻將指標指向正確的變數,如果無法一開始就讓指標設值的話,最好利用NULL使指標不指向任何記憶體位址。例如:
int a,*ptr1,*ptr2;
ptr1=&a;
ptr2=NULL;

學習matlab

一些指令,要慢慢累積。
(1)unique()→把相異的數,秀出來。
(2)length()→把一個陣列的個數秀出來。
舉例:
a=[1 1 2 5 6 6]
unique(a)→a=[1 2 5 6]
length(a)→a=6

應用方面:
要計算一個龐大且裏面有相同數目數量有多少?(不用計算重覆的)
length(unique(a))→4

再來介紹一下length(1,:)或是length(:,1)或是length(:,:)或是length(1,1)
第一個length(1,:)→1 1 2 5 6 6 (註是x軸的)
第二個length(:,1)→1(註是y軸的)
第三個length(:,:)→指全部。
第四個length(1,1)→1(座標1,1的位置)

2008年5月30日

Blog Post with Word 2007

剛剛發現可以直接利用Office 2007於blogger上進行貼文,如此一來可以更方便大家進行知識交流的工作,不需要特別在網路上打字,只需要透過原來熟悉的Word的編輯,將自己手邊的研究,放在這裡與大家分享,並可在自身電腦有份備份,以下為設定方式:

步驟一: 進到Publish 裡的Blog,裡頭就會看到位置,橫線上方為文章標題,下方則為文章,編輯方式與一般於Word裡頭相同


步驟二:完成後,按左上方的Publish,裡頭會要求你設定blog server以及picture server,

  1. 將blog server設定為blogger,以及使用您的google或是研究室帳號登入
  2. 將picture server中Upload Url以及Source Url皆為研究室ftp server,位置為ftp://140.112.190.162/blog,使用者為匿名(anonymous),密碼為空白。設定完成後,即可貼文。


MATLAB 之工程應用

http://bime-matlab.blogspot.com/

http://www.mathworks.com/

一些幫助初學者學習matlab的網路資源,在學習matlab的學弟妹們可多加利用參考。:)

From Shummi  

GIS programming learning resources

  1. A UNC class website by Dr. Liang
  2. A class from Colorado state by Dr. Leyk
  3. A class from U of Colorado by Dr. Sambrook
  4. A python GIS class from U of Washington
  5. ArcGIS Help in Geoprocessing script

VBA
  1. VBA with ArcObjects
  2. VBA ArcGIS Environment
  3. 空間資訊與程式設計
ArcObjects Online
ArcGIS Developer Online

Introduction to GIS lectures

  1. Introduction to GIS by Dr. Kumar in Dept of Ecosystem management in U of New England, AU
  2. GIS I: by Dr. Duh in Dept of Geography in Portland State University, USA with textbook Geographic Information Systems and Science by Drs. Longley, Goodchild, Maguire, Rhind
  3. GIS application II by Dr. Duh in Dept of Geography in Portland State University, USA

GIS softwares

  1. Xtoolspro is a shareware for ArcGIS which provides many useful functionality addition to the original ArcGIS functions.
  2. SaTScan: A free software that analyzes spatial, temporal and space-time data using the spatial, temporal, or space-time scan statistics.

GIS resources

  1. Few ArcGIS Notes from a website of a doctoral student in NTU
  2. Taiwan GIS resources from a class document in 2008 spring
  3. GIS resources page from Duke university which has a very well-organized with simple description and links
  4. Computer Geography page from Ireland which provides some lecture notes about Computational Geography (such as small area problem and Spatial analyst) and also many useful GIS resources.

Projection transformation

It has been confused me for a while. How to define or transform the projection of a shapefile in ArcGIS such that it can align with other maps with different coordinate system. Here is the steps in ArcGIS 9.X.
  1. Figure out the original projection of your map even though it has not been defined before, namely it does not have any projection file (*.prj) along with other files for shapefile.
  2. Two coordinate system can be defined in a shapefile, one is geographical coordinate system which is essentially for longitude and latitude; the other one is projected coordinate system which is for the planar coordinate (two-dimension)
  3. To define a coordinate system to a shapefile, Go to ArcToolbox -> Data Management Tools -> Projections and transformations -> Define projection, and then a window will popup for us to select the shapefile (feature class) to define and the coordinate system
  4. To change a coordinate system of a shapefile in order to align with other shapefile,
    1. Determine the coordinate system to which we would like to transform
    2. Go to ArcToolbox -> Data Management Tools -> Projections and transformations ->Feature -> Project
    3. Specify the shapefile to transform (feature class), the name for the new shapefile with new coordinate system (projection), and the new coordinate system in the popup window
    4. OK
  5. The new shapefile will automatically be added into the current project
  6. Note that the table of the new shapefile is exactly the same as the original shapefile. The new geometry values upon the new coordinate system can be generated by adding new field in the Table and do the Geometry calculation.

To adjust the position of maps in ArcGIS

Here I encounter an interesting problem that two Taiwan shapefile with two different administrative units can not completely overlay to each other (shown in the first figure below). It confused me a lot and made me think that the projection definition can be an issue for these maps. Some solution for the change of projection system in ArcGIS is discussed in this document. The projection definition indeed has some issue in Taiwan area where several definitions exist concurrently and are inconsistent. For the detail information about the projection issue in Taiwan.
  1. Introduction to projection system and definition of two-degree transverse Mercator (二度分帶)
  2. The webpage for the description the three common Transverse Mercator system TWD67 (Taiwan Datum 67), TWD97 (Taiwan Datum 97), WGS84 (World Geodetic system 84)
  3. A very informative educational website
  4. Projection system transformation
However, in fact, the solution of the displacement of these two shapefiles in ArcGIS does not have anything to do with the coordinate systems, according to the experience drawn from the trials by myself and my student. Here is the solution to adjust the map proposed by Chi-Shih
  1. 開啟arcmap選擇a new empty map
  2. 看到一個黃色+號圖形,把這三張圖讀出
  3. toolseditor bars→會出現編輯的工具列
  4. editorstart editing→就可以開始編輯
  5. 先打勾里村跟縣市(或鄉鎮)作對比
  6. 看完對比之後,只那村里勾選→用滑鼠把外島那一部份框起來,移至最左邊,不要擋到其它那兩張圖外島的位置就行了
  7. 然後勾選其它兩張任一張圖,做對比→一一的移動到適當的位置
  8. 完成了之後,到editorstop editing→它會問要不要存檔→ok→即完成


Extract points from polyline in ArcGIS

Here is a visual basic macro for ArcGIS to generate points on the polylines. How to use these codes. Few steps are discussed below:
  1. Add the polyline shapefile in your ArcMap project.
  2. Create a point shapefile in ArcCatalog by right-click a specific folder and select New to create a new point shapefile in which the to-be-generated points will be saved.
  3. In ArcMap, Go to Tool > Macro > Visual Basic Editor > Project > ArcMap Objects > ThisDocument
  4. Copy the VB script attached below and paste into ThisDocument
  5. Highlight the polyline shapefile to be extracted
  6. Click the "Run Sub" button to execute the script
  7. Done !!
----------------------------------------------------
Public Sub CreatePointsAlongCurve()
'Creates points at a set distance along any feature implementing ICurve
'
'Justin Johnson
'January 23, 2004
'justin.johnson@geog.utah.edu
'
'Obtains selected features from currently-selected Layer
'Stores new points in point theme at top of TOC

Dim pMxDoc As IMxDocument
Dim pMap As IMap
Dim pInGeometry As IGeometry
Dim pInLayer As ILayer
Dim pInFLayer As IFeatureLayer
Dim pOutFLayer As IFeatureLayer
Dim pInFCursor As IFeatureCursor
Dim pOutFCursor As IFeatureCursor
Dim pOutFBuffer As IFeatureBuffer
Dim pInFClass As IFeatureClass
Dim pOutFClass As IFeatureClass
Dim pSelSet As ISelectionSet
Dim pFSelection As IFeatureSelection
Dim pInFeature As IFeature
Dim pCurve As ICurve
Dim pPointCollection As IPointCollection
Dim pConstructMultipoint As IConstructMultipoint

Set pMxDoc = ThisDocument
Set pMap = pMxDoc.FocusMap
Set pInLayer = pMxDoc.SelectedLayer

If pInLayer Is Nothing Then 'Check if no input layer is selected
MsgBox "Select a feature layer in the TOC", vbCritical, "Incompatible input layer"
Exit Sub
End If

If TypeOf pInLayer Is IFeatureLayer Then 'check if selected layer is a feature layer
Set pInFLayer = pMxDoc.SelectedLayer 'set selected layer as input feature layer
Else
MsgBox "Select a feature layer in the TOC", vbCritical, "Incompatible input layer"
Exit Sub
End If

Set pOutFLayer = pMap.Layer(0) ' set top layer in TOC as output feature layer
Set pInFClass = pInFLayer.FeatureClass
Set pOutFClass = pOutFLayer.FeatureClass

If Not pOutFClass.ShapeType = esriGeometryPoint Then 'check if output layer is Point type
MsgBox "Geometry type of output layer is not Point", vbCritical, "Incompatible Output Layer"
Exit Sub
End If

'Get selected features, if any
Set pFSelection = pInFLayer
Set pSelSet = pFSelection.SelectionSet

'Prompt user for distance between points
Dim pPointDist As Double
pPointDist = InputBox("Distance between points: ", "Point Spacing in Map Units")

'Create an Insert cursor on output feature class
Set pOutFBuffer = pOutFClass.CreateFeatureBuffer
Set pOutFCursor = pOutFClass.Insert(True)

If pSelSet.Count <> 0 Then
'use selected features from input feature class
pFSelection.SelectionSet.Search Nothing, True, pInFCursor
Else
'use all features if none are selected
Set pInFCursor = pInFClass.Search(Nothing, True)
End If

Dim k As Long 'count the number of points created
k = 0

Set pInFeature = pInFCursor.NextFeature

Do While Not pInFeature Is Nothing

Set pInGeometry = pInFeature.Shape
Set pCurve = pInGeometry
Set pConstructMultipoint = New Multipoint

pConstructMultipoint.ConstructDivideLength pCurve, pPointDist

Set pPointCollection = pConstructMultipoint

Dim i As Long
For i = 0 To pPointCollection.PointCount - 1

Set pOutFBuffer.Shape = pPointCollection.Point(i) 'store the new geometry
pOutFCursor.InsertFeature pOutFBuffer
k = k + 1

Next i

Set pInFeature = pInFCursor.NextFeature

Loop

pMxDoc.ActiveView.Refresh
MsgBox k & " points created in " & pOutFLayer.Name, vbInformation, "Complete"

End Sub