(if not, go to check “tool”-->”customize”-->”toolbars”-->”spatial analyst”
1.the same as ArcView, Be sure your data is numeral.
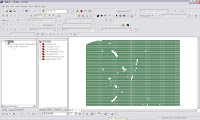
2.Open ArcMap,
“tools”-->”add XY data”, then the interface will look like this
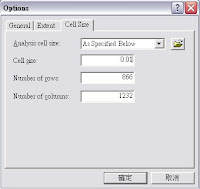
3.Definition the range of analysis
Spatial Analyst-->Options-->Cell size-->AS specified below(you can choose any size you want , for this example, it’s “0.01”
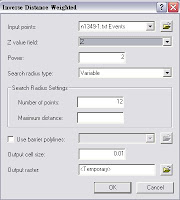
4.Point-->contour
Spatial Analyst-->Interpolate to RasteràInverse Distance Weighted.
In Z value field, choose the data you want to draw, then clip OK
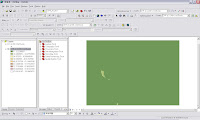
5.Final, the appearance will like that.
沒有留言:
張貼留言